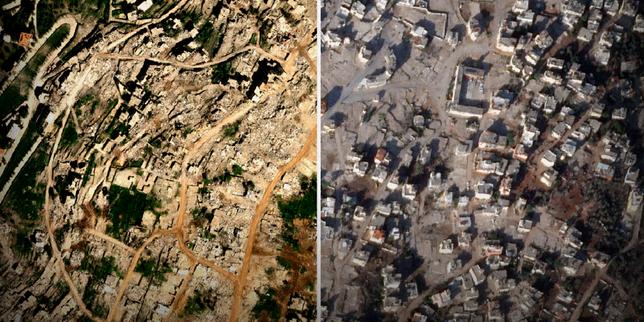
Satellite imagery does not lie. When geopolitical conflicts flare up, propaganda machines on all sides work overtime to control the narrative. We see conflicting press releases, carefully curated military footage, and chaotic social media clips that confuse more than they clarify. But you cannot hide flattened neighborhoods from space. Measuring the actual physical footprint of war requires moving past the rhetoric and looking directly at the data.
Tracking the physical damage in southern Lebanon since late 2023 reveals a pattern of destruction that standard news reports completely miss. Relying solely on local reporters on the ground is dangerous and often impossible due to active shelling. Instead, open-source intelligence analysts and journalists rely on radar data, high-resolution optical imagery, and thermal sensors to build an undeniable record of the damage.
This is how modern investigative journalists map the scars of conflict with precision, proving exactly what has happened to the border villages of southern Lebanon.
The Science Behind Mapping War From Space
You cannot just open Google Earth and see what happened yesterday. Most free satellite mapping tools use images that are months, sometimes years, old. To track destruction in real-time, investigators rely on specialized commercial satellite providers like Maxar Technologies and Planet Labs, alongside public data from the European Space Agency’s Sentinel satellites.
Open-source analysts rely heavily on two distinct types of satellite technology.
Synthetic Aperture Radar
Optical satellites need clear skies and daylight. Clouds, smoke, and nighttime render them useless. Synthetic Aperture Radar, or SAR, solves this. SAR satellites emit radar signals down to Earth and measure how those signals bounce back.
Buildings have sharp angles that reflect radar waves strongly, showing up as bright spots on a sensor. A collapsed building, a cratered field, or a pile of rubble scatters the radar waves differently. By comparing a pre-conflict SAR scan with a recent one, computer programs highlight the exact areas where the reflection changed. This process, known as Coherence Change Detection, reveals structural damage hidden by smoke or clouds.
High Resolution Optical Imagery
Once radar flags a potential blast site, analysts deploy high-resolution optical imagery to confirm the findings. Companies like Maxar capture images where each pixel represents just 30 centimeters of ground space. At this resolution, you can easily identify individual collapsed roofs, scorched earth, burned vehicles, and artillery craters.
The human element matters here. Software can flag a change in pixels, but human eyes verify whether that change represents a destroyed home or just a truck parked in a different spot.
What the Data Reveals About Southern Lebanon Villages
The numbers paint a stark picture. Investigative groups, including reporting teams from Bellingcat and various international newsrooms, have systematically analyzed these border towns. The focus rests heavily on a strip of land running along the Blue Line, the UN-recognized border between Lebanon and Israel.
Towns like Ayta al-Shab, Kfar Kila, and Mhaibib have borne the brunt of the bombardment. In some border communities, temporal analysis of satellite tracks shows that over 60 percent of the civilian infrastructure has suffered severe structural damage or total collapse.
This is not a matter of isolated collateral damage. The data shows a systematic leveling of built-up areas. Entire blocks of residential homes, local businesses, and agricultural infrastructure have vanished from the map over the course of the conflict. Analysts match the timeline of these structural changes with official military announcements and localized video feeds to verify the cause of destruction.
The Flaws in Official Narratives
Governments routinely minimize the civilian impact of military operations. Official briefings often claim precision strikes targeting specific tactical assets. The satellite data tells a wildly different story.
When you look at a village like Ayta al-Shab through consecutive satellite passes, you notice the destruction spreads outward from initial impact points. Precision munitions definitely hit specific coordinates, but the subsequent use of heavy artillery and explosive demolition creates a footprint of widespread ruin.
Furthermore, thermal sensors from NASA's FIRMS (Firms Fire Information for Resource Management System) track active fires. In southern Lebanon, these thermal sensors picked up massive spikes in agricultural zones. The data proves that white phosphorus and incendiary shells have scorched hectares of olive groves and farmland. This destroys the local economy long after the smoke clears. It is a slow-motion economic devastation that conventional news reports rarely quantify.
How to Verify Satellite Data Yourself
You don't need a degree in aerospace engineering to understand or verify these findings. The open-source intelligence community thrives on public verification. Anyone with a computer can begin analyzing the structural changes in these conflict zones.
Start with Copernicus Browser, which provides free access to Sentinel-1 radar and Sentinel-2 optical data. It updates every few days. Look at the normalized difference vegetation index to see where farmland has been burned away in places like Yaroun or Maroun al-Ras.
For high-resolution tracking, follow verified geospatial analysis accounts on platforms like BlueSky or X. Look for researchers who publish their methodology alongside their imagery. The best analysts always provide the exact coordinates, dates, and satellite source codes so anyone can replicate their work.
The physical reality of the destruction in southern Lebanon remains permanently etched into the geographic record. No amount of political spin can erase the data points recorded from orbit.